What's that parking lot costing your city?
If you live in North America, you’re probably used to seeing scenes like this.
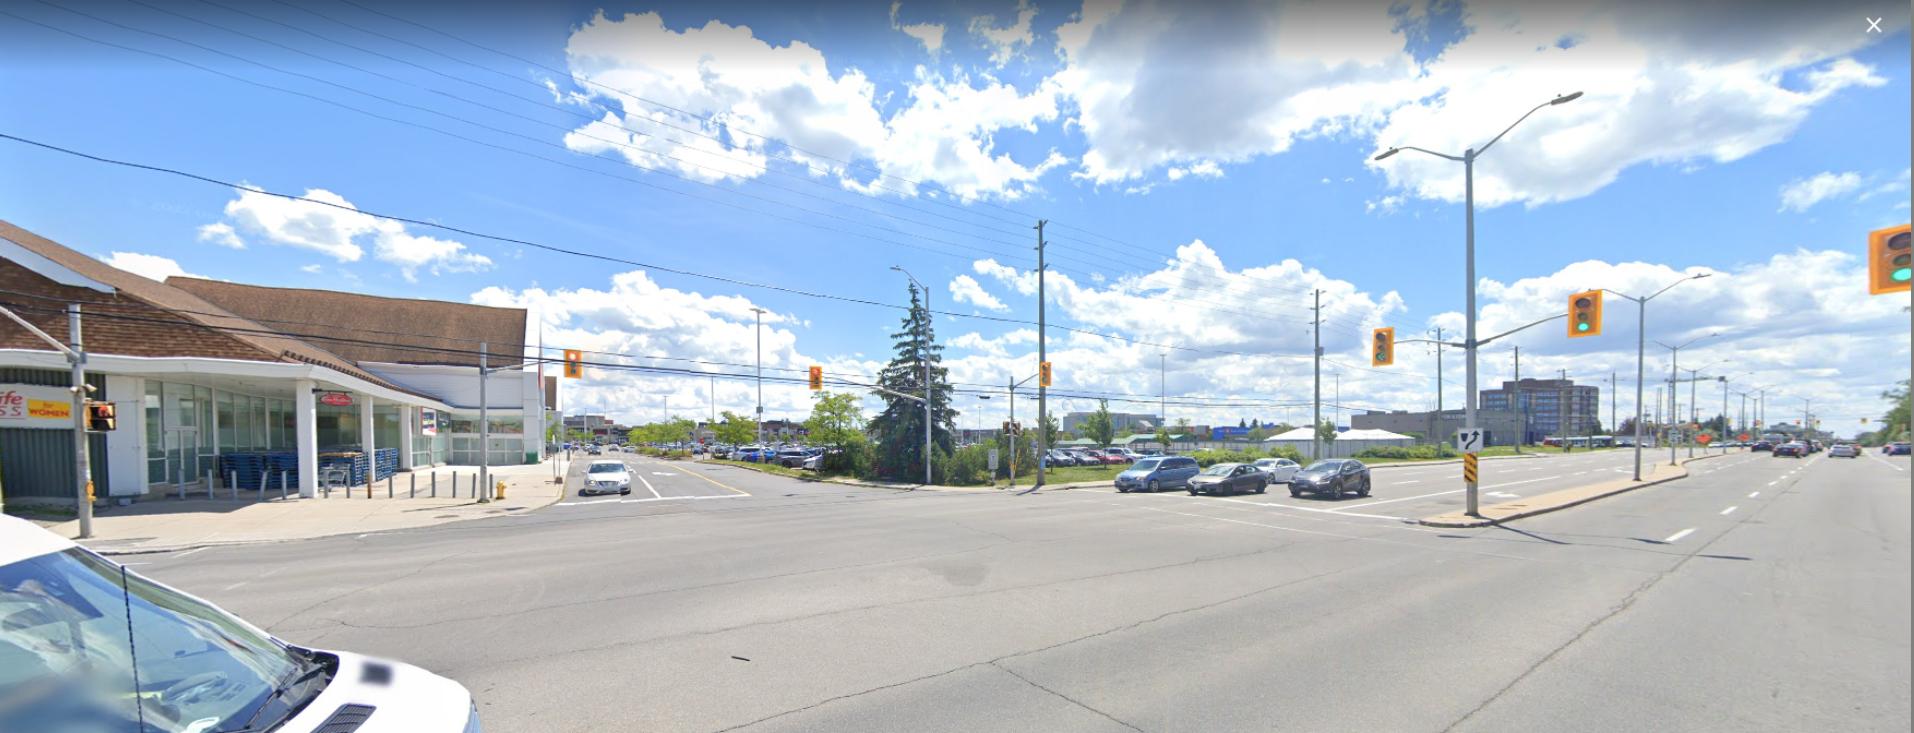
A bunch of asphalt, a couple traffic lights, a big store and some greenery.
Some people might love it, some might hate it, but to most of us this looks so normal we don’t think about it. That’s a shame, because what you see here results in reduced services and crumbling infrastructure if you’re lucky, and digs your city deeper into debt on top of that if you’re not.
Let’s take a closer look at what else could have been done, and figure out just how much money we’re leaving on the table.
Case study: suburban grocery store
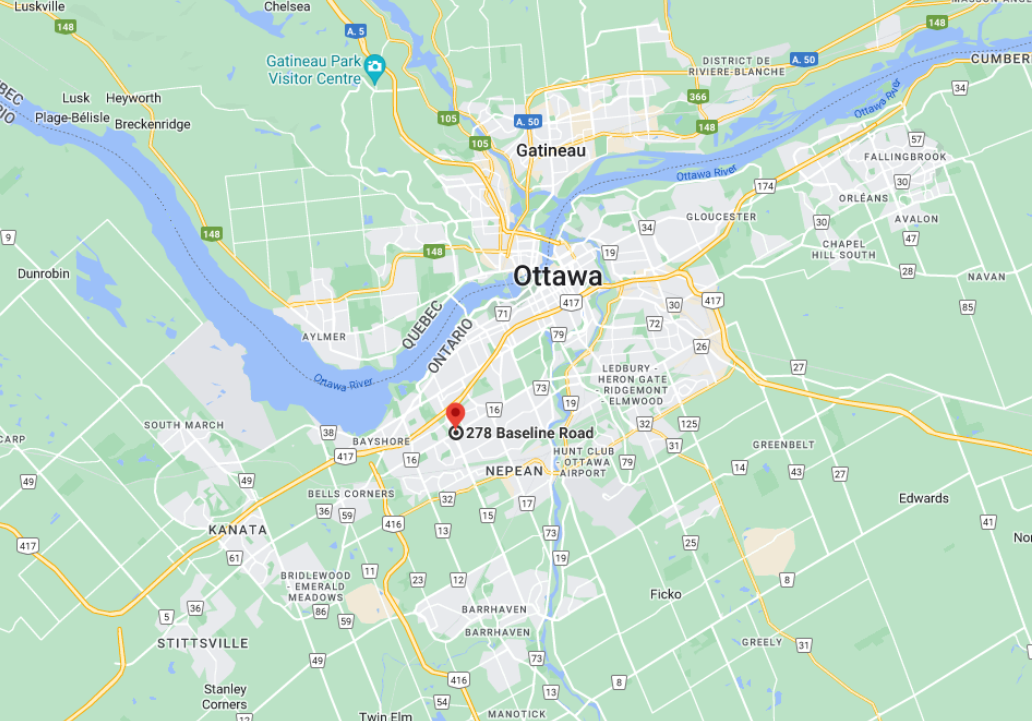
The location from the first image is a good place to start. It’s a google street view shot from roughly halfway between the middle and the edge of the city of Ottawa, Canada. A mid sized city with a fairly standard North American layout.
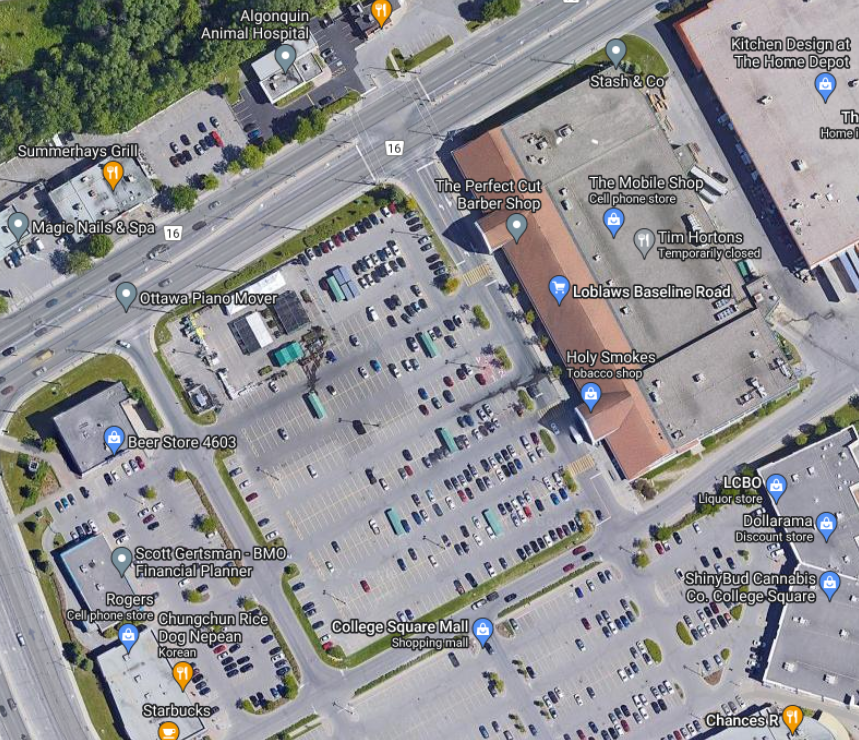
From above we can see exactly what we’re dealing with. A standard suburban arterial road/shopping mall combo.
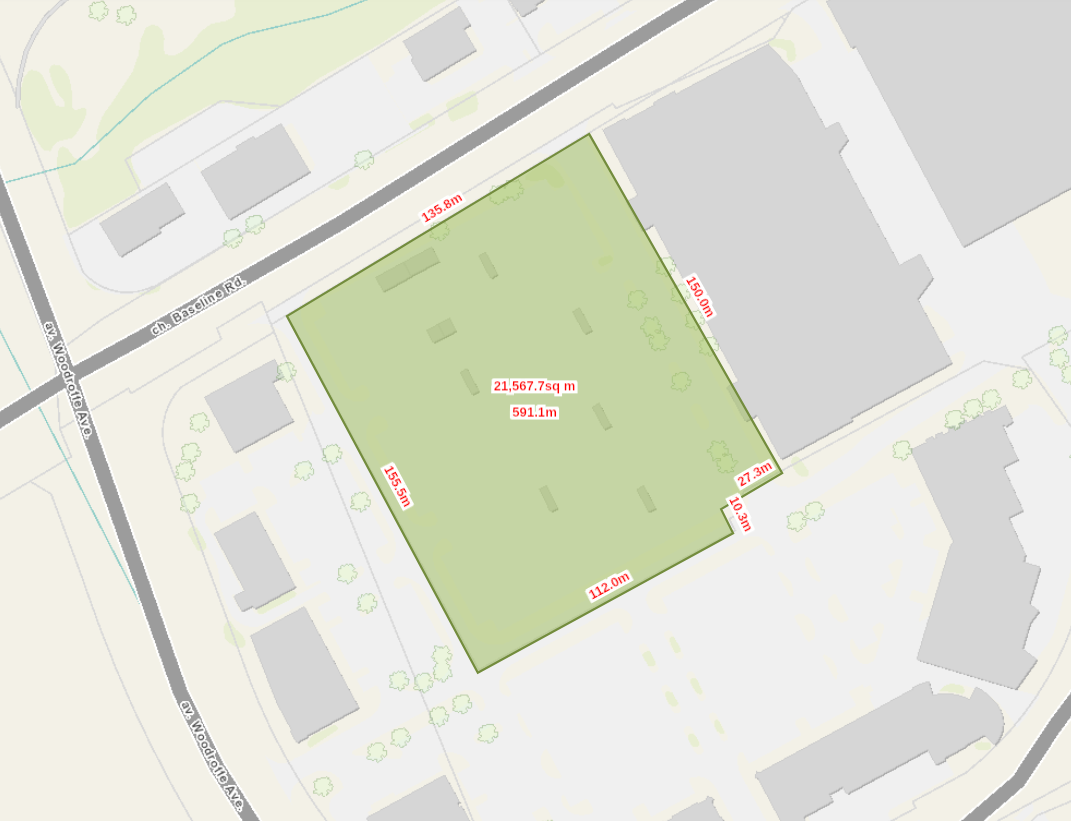
This place big! Mapping this area out using Ottawa’s gis tools we can see it is around 2.15ha (hectare). That’s almost 5 football fields in American Journalism Units
What else could we put there?
This spot could have been used for housing. That housing would generate significantly more revenue for the city from property taxes, but people living there would also cost more to service. On the surface it’s not obvious what the net result is, but a report commissioned by the city of Ottawa shows that the housing would generate an average excess of $455 CAD per person[1] (according to new sources I can’t verify this number might now be $606 per person[2]).
To get to dollar value for that parking lot we need to know how many people could live in that space. Using an average of of 2.5 people per household given by StatsCan[3] we can look at a few different types of housing to get a range of values[4].
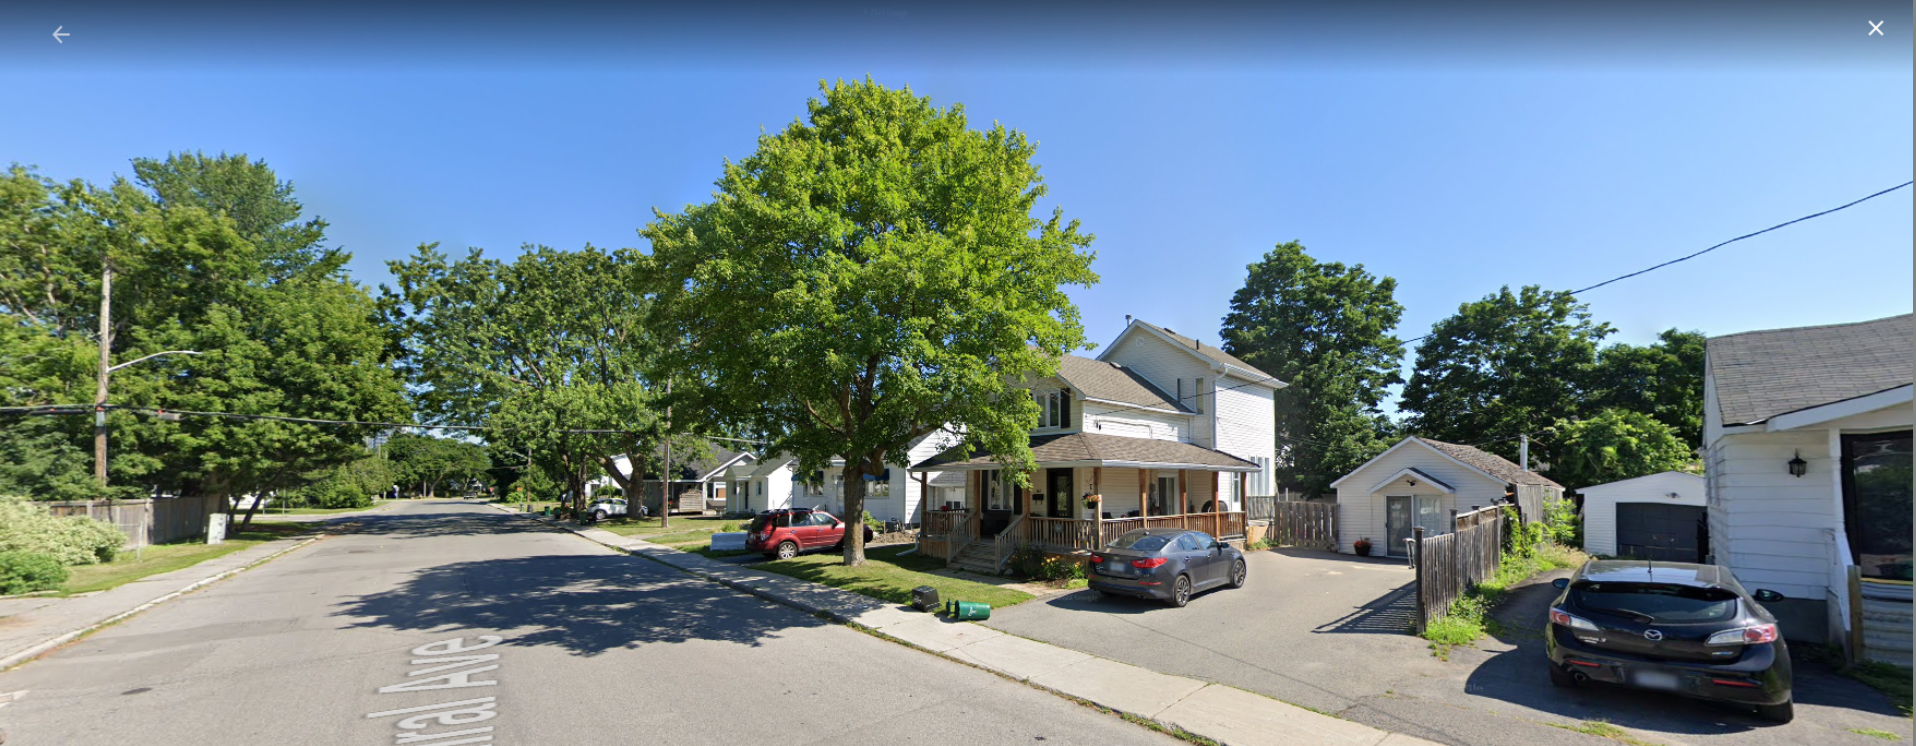
Low density
This is an example of the least dense development that could realistically be built in a city. It’s not far from the parking lot we’re talking about. Pretty normal looking by North American standards
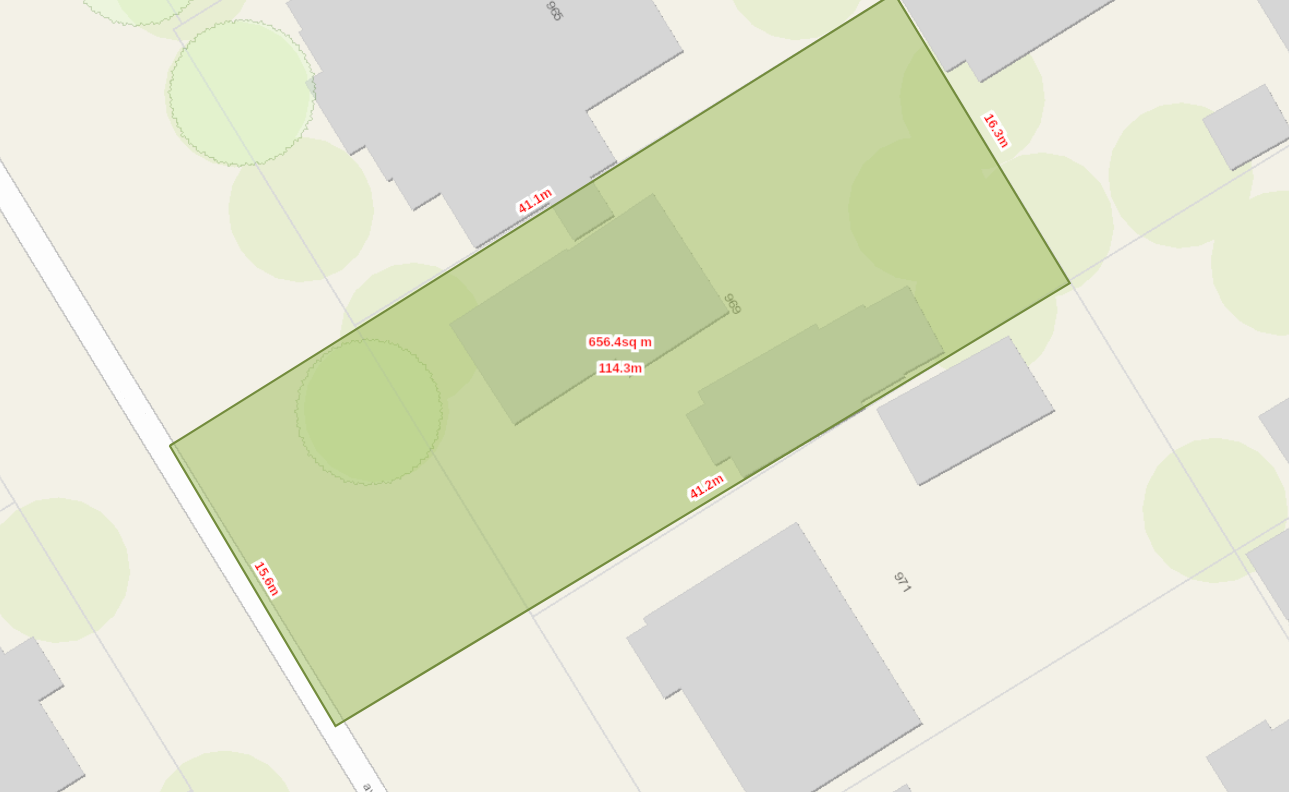
Using the same GIS tools, it’s got an area of 656m^2, which translates to ~38 people/ha. The area here includes the property itself and the portion of the road that accompanies it.
Medium density
This type of housing is standard in many cities around the world, but is generally missing in North America. It is much more dense, but not to the point of high rises or crowded streets. The image below is an example from Montreal nearby where I used to live. It’s a pretty nice place.
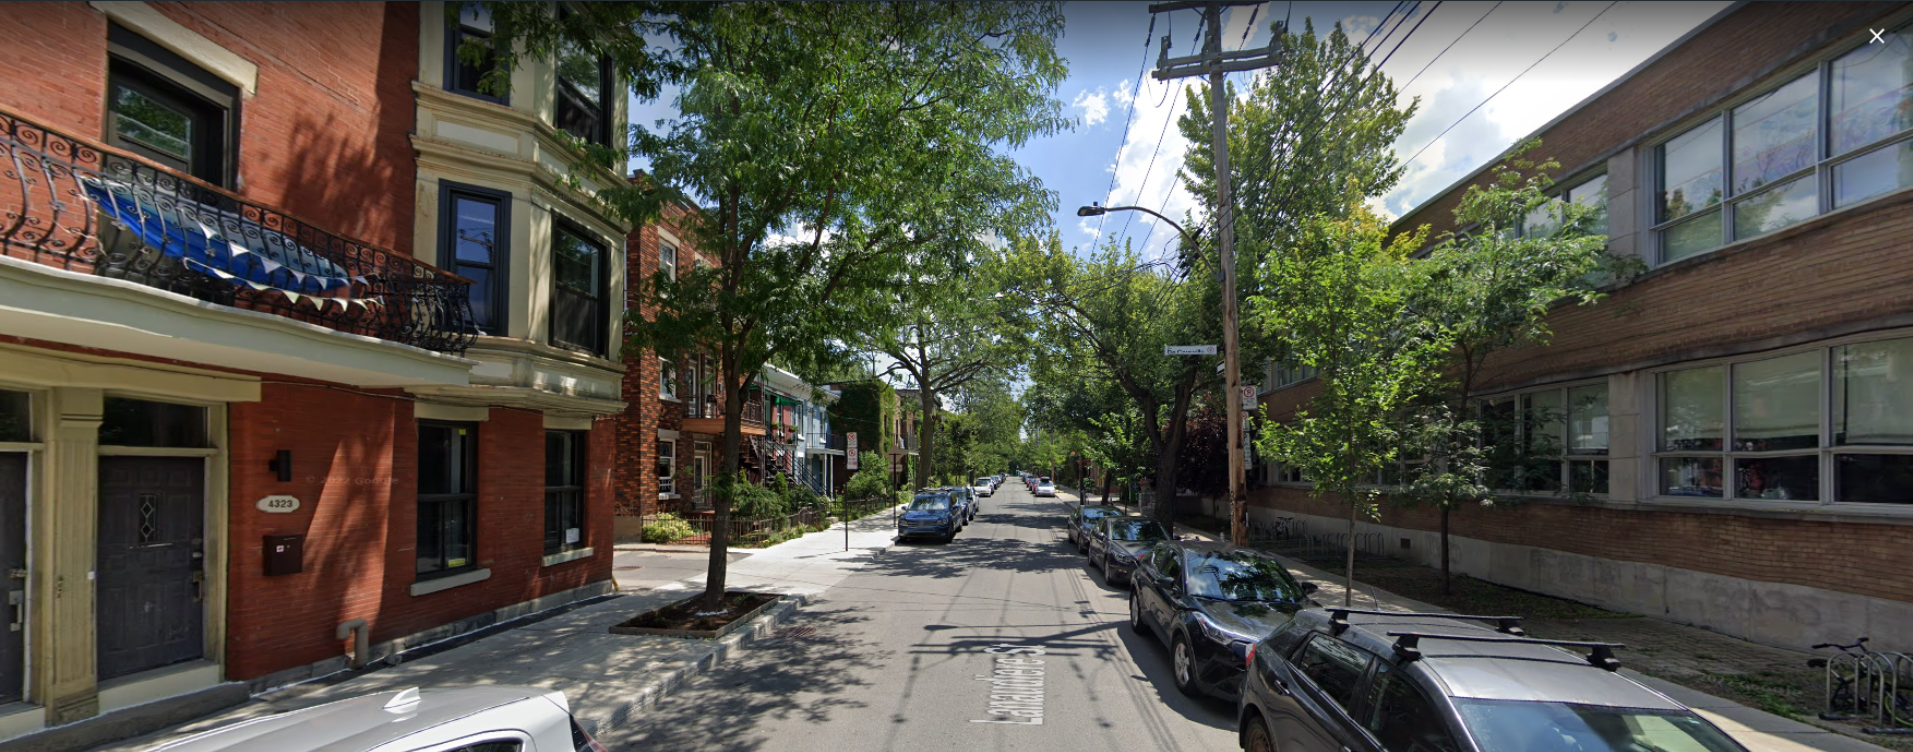
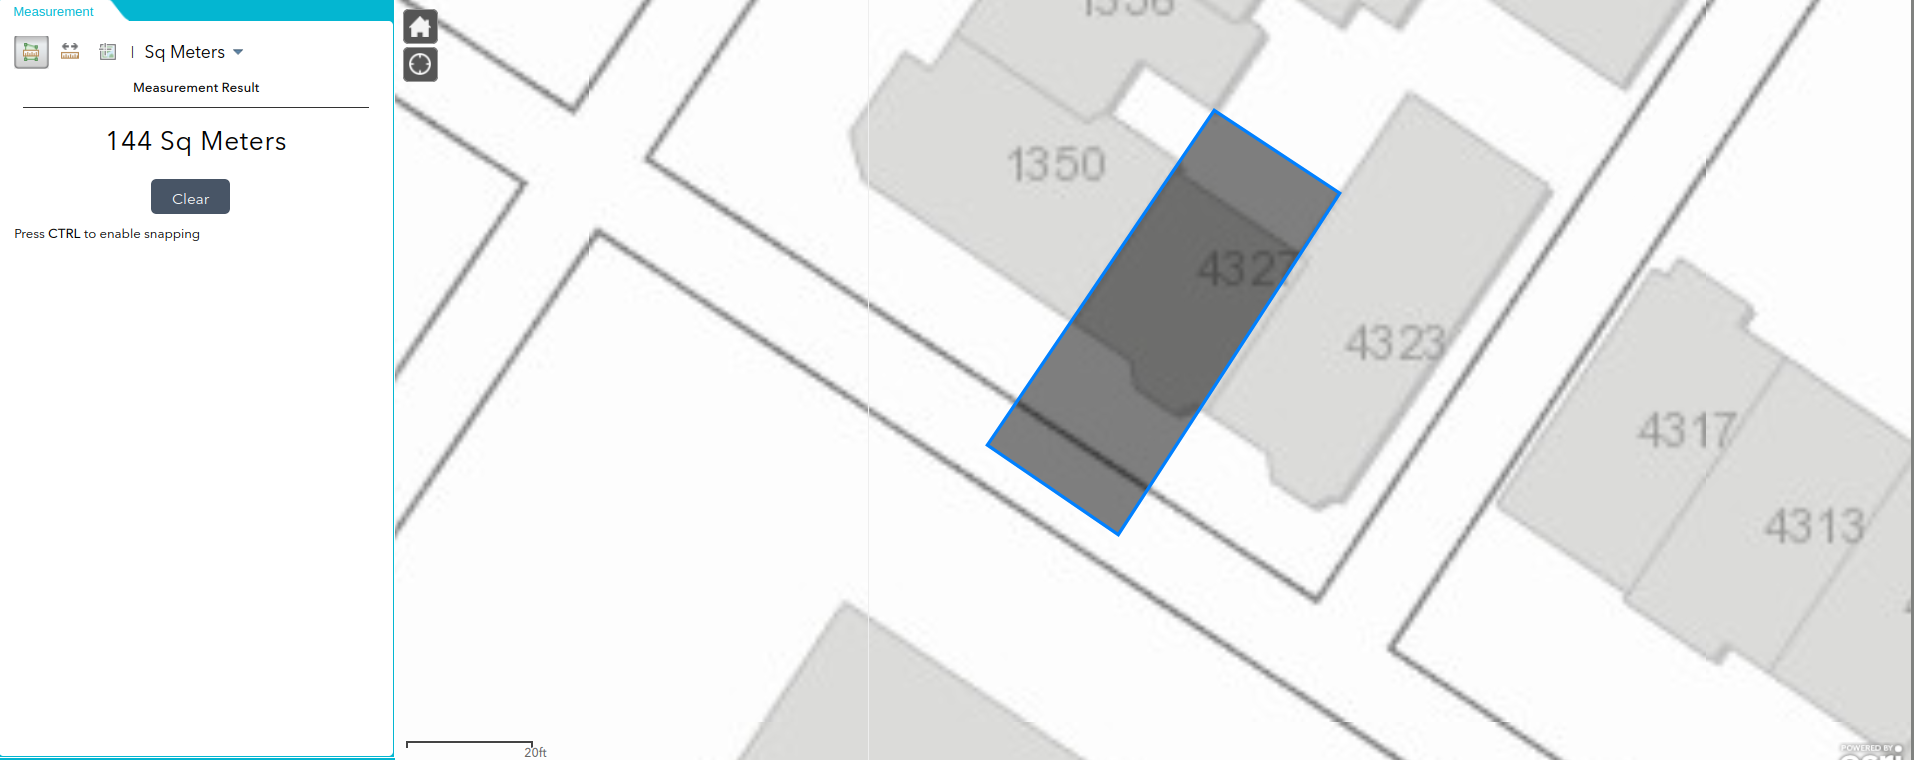
The building on the left is 3 stories tall and contains 2 and 3 bedroom units. This keeps our assumption of 2.5 people per unit valid, and gives us 3 units in 144m^2, which works out to 520 p/ha
We get the area using Montreal’s slightly different GIS tool.
High density
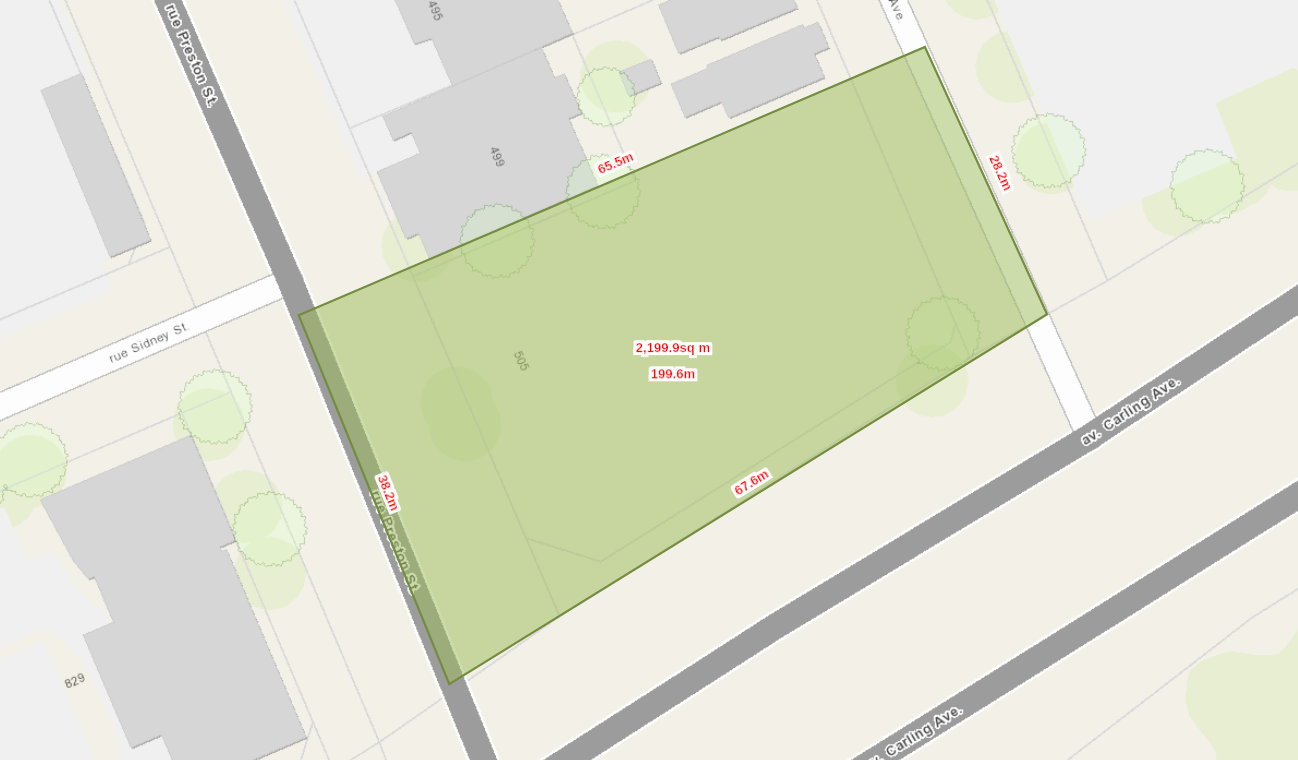
Moving on to high-rises, we can look at 505 Preston Street in Ottawa. It is recently constructed tower. Fairly high, but not setting any records. Something you could reasonably expect to see in a mid to large size city. It’s not where everybody wants to live, but there’s clearly demand for large towers.
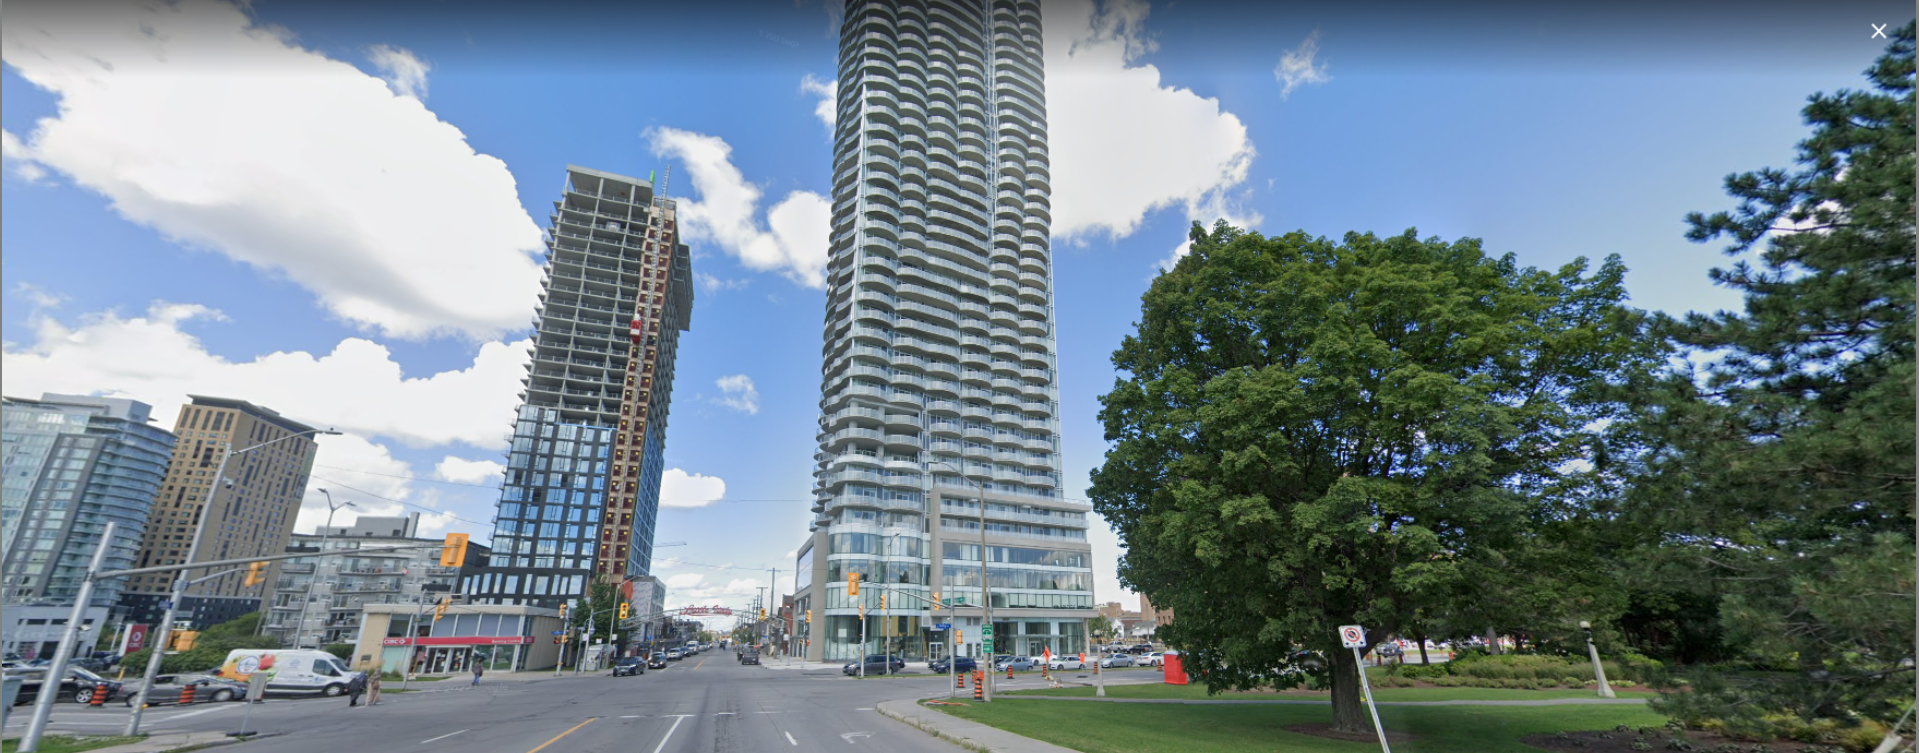
Going with the average of 2.5 people per residence is unrealistic here, so we can go with the assumption of 1.8 people per unit (ppu) used in their planning docs[5]. That takes us to 576 people in 2200m^2 = 2618 p/ha. As you’d expect, the density of high-rises like this is pretty high.
Note that we won’t be taking into account the revenue generated by the bottom floors of commercial space, so we are under counting significantly.
Results
This is a pretty rough calculation, but to take into account things like parks and street corners we can lower all the density values by 10%.
To sanity check our approach we can compare this to the neighbourhood of Riverdale in Toronto. It’s mixed but mostly detached homes. With a density of 77.7[6] people/ha it falls pretty much where we would expect it.
Now we can plot out our data, and see how much revenue that parking lot could generate each year.
| Density | People/ha | $/ha | $/parking lot |
|---|---|---|---|
| Low | 34 | $15,470 | $33,260 |
| Riverdale | 78 | $35,490 | $76,303 |
| Medium | 468 | $212,940 | $457,821 |
| High | 2,356 | $1,071,980 | $2,304,757 |
To put this in perspective, this single parking lot could generate over 10% of the city of Ottawa’s entire $20 million annual budget for childcare. Or enough revenue to fund about 1 and a half libraries.
It’s not about one parking lot though, it’s about the entire city. Our cities could have huge surpluses to spend on services and infrastructure, so next time you see an underutilised park, giant road or urban farm, think about what else it could be.
[1] Hemson fiscal impact analysis - 2013
[2] Suburban expansion costs increase to $465 per person per year in Ottawa - CBC News
[3] The shift to smaller households over the past century - Statistics Canada
[4] This doesn’t take into account the tax revenue from the land improvements due to the original parking lot, but big box stores are notorious for paying incredibly low values of property tax. I don’t think the parking lot in front of the store is generating much value over undeveloped land.
- https://ca.news.yahoo.com/big-box-retailers-win-tax-231458188.html
- https://slate.com/business/2019/02/dark-store-theory-big-box-stores-property-taxes.html
[5] https://en.wikipedia.org/wiki/Demographics_of_Toronto_neighbourhoods